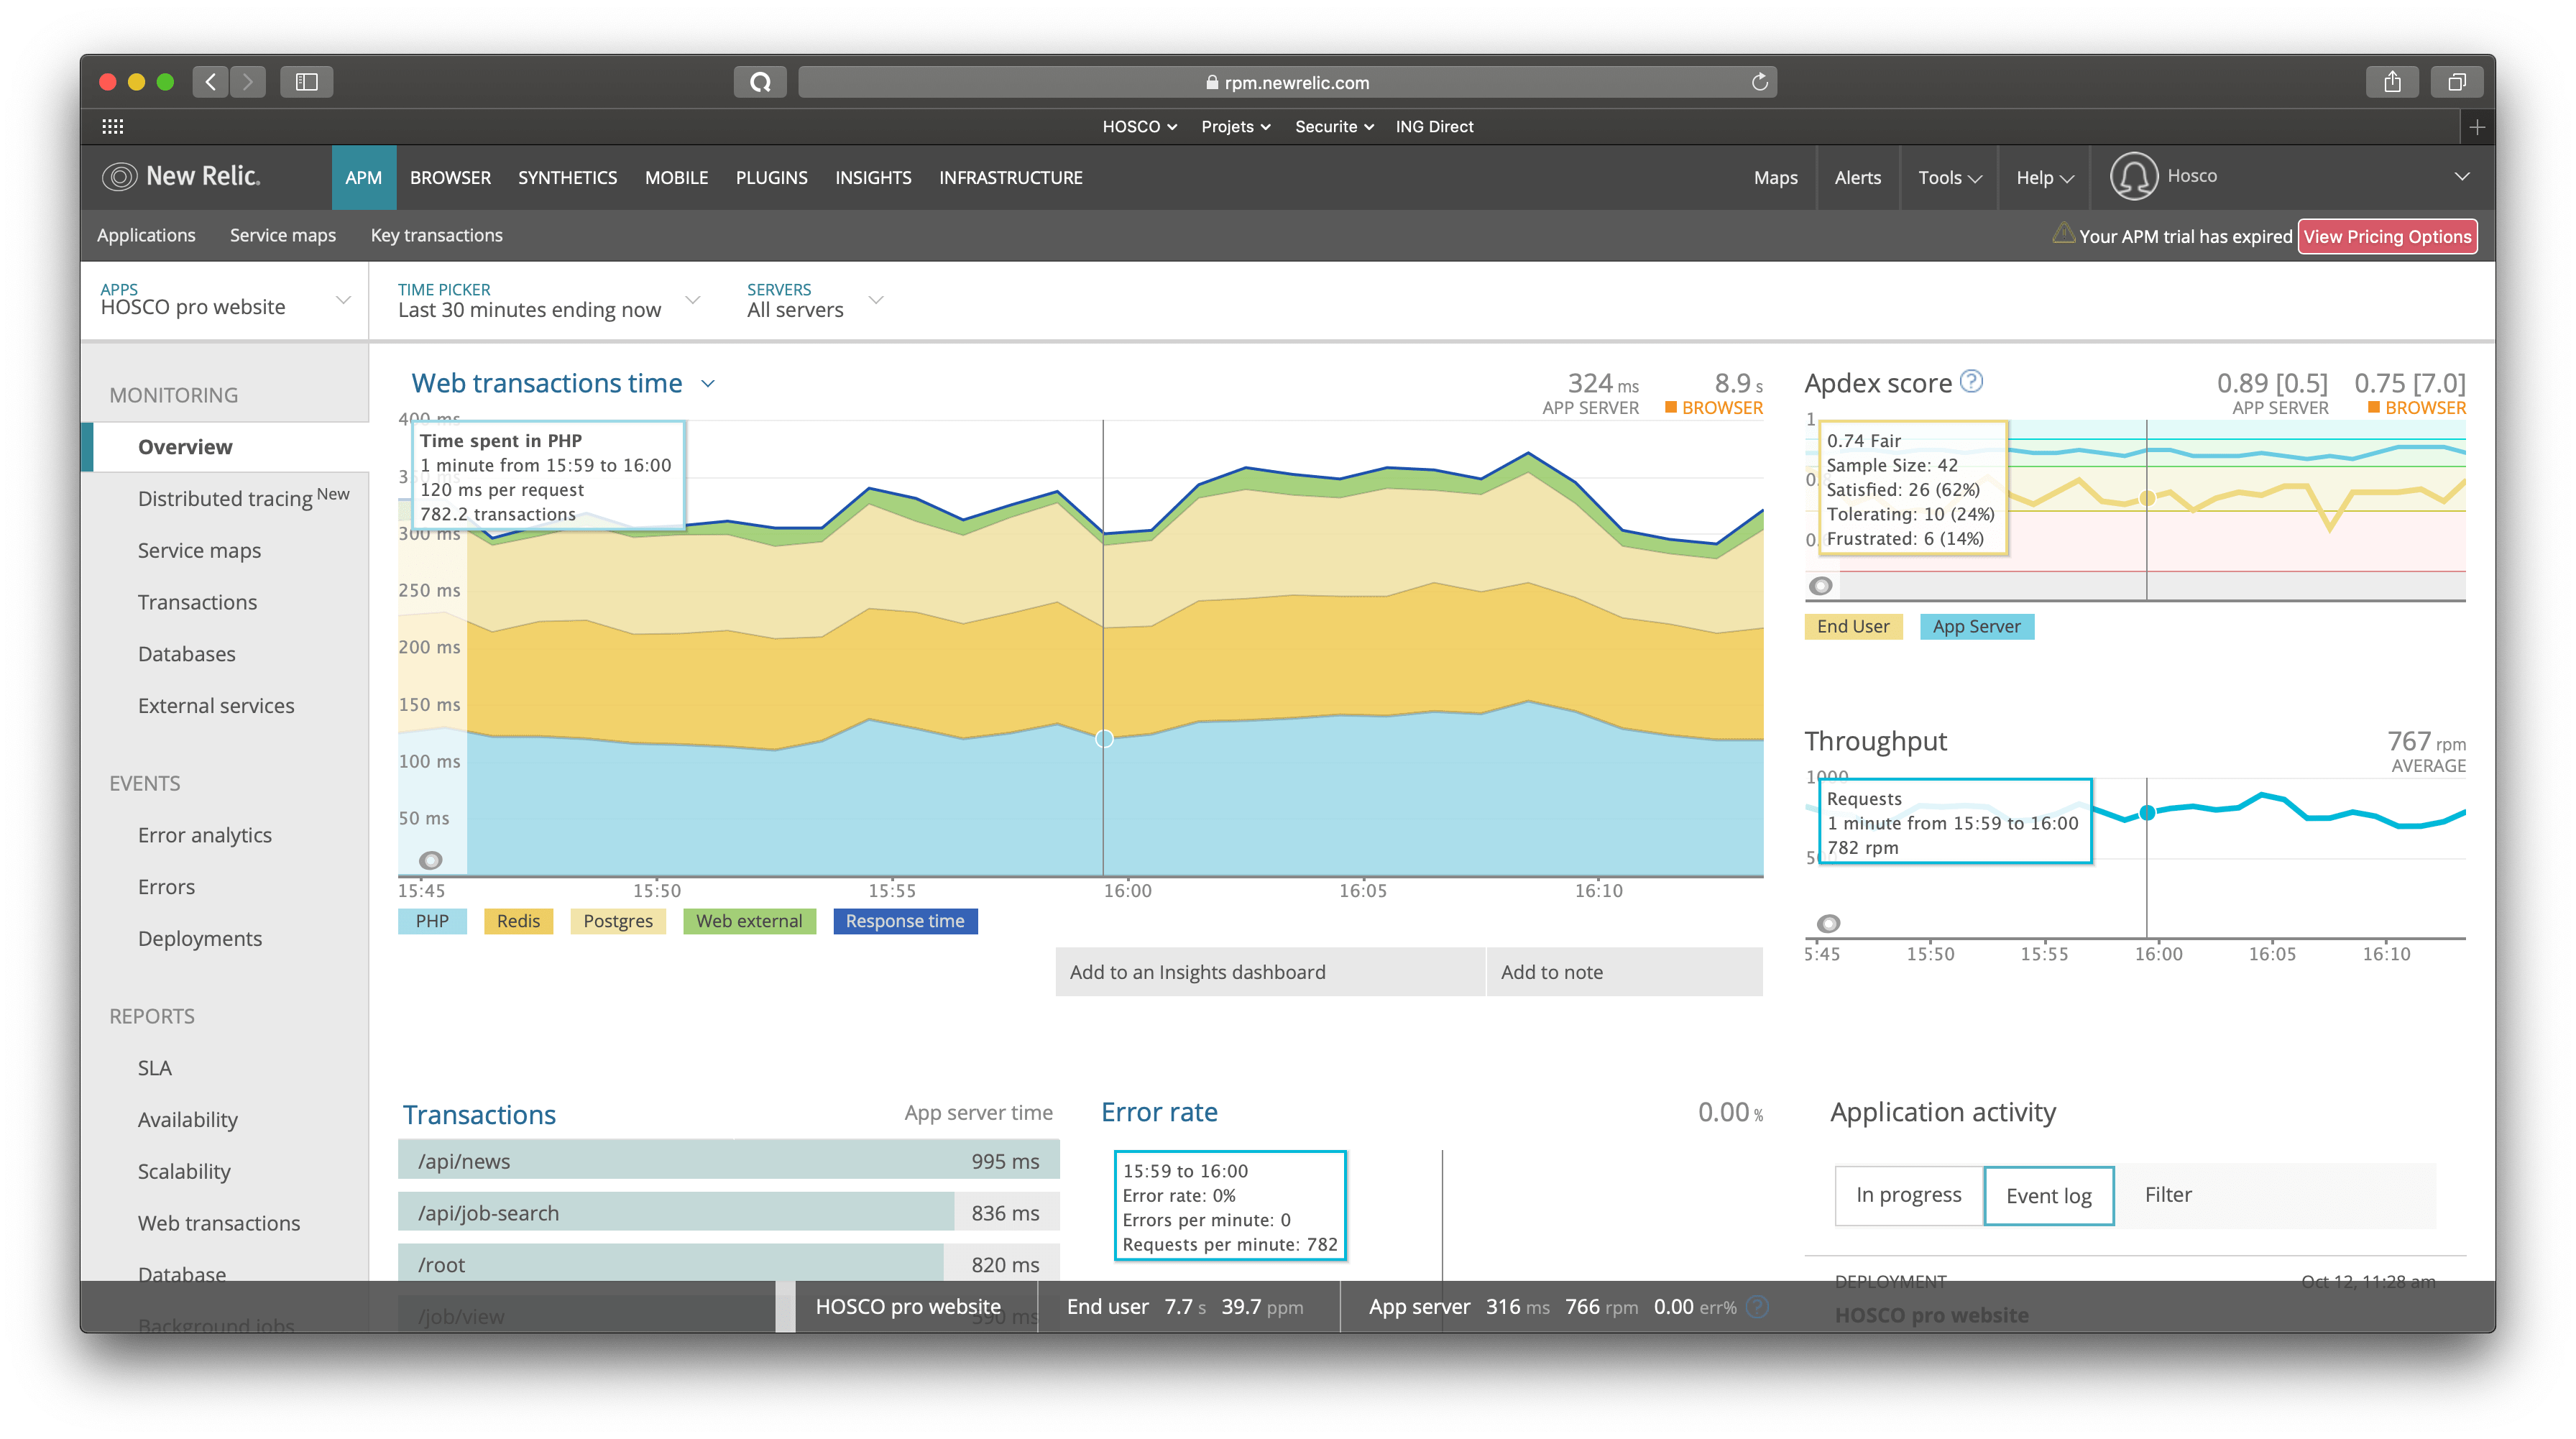
Here, at Hosco, we use NewRelic to monitor our applications.
But, because we want to split our monolith into microservices, we use Grafana and Prometheus to collect all metrics... and we want to use only one tool.
Grafana/Prometheus are free, NewRelic is not free...
So we created a new microservice to export NewRelic metrics to Prometheus and display it with grafana: https://gitlab.com/hosco/ops-newrelic-exporter.
#Clone the repo and build the image
docker build -t ops-newrelic-exporter .

# Run it
docker run --rm -e NEWRELIC_API_KEY=xxxxxx -p 9000:9000 ops-newrelic-exporter

# Get the result
curl http://localhost:9000/metrics
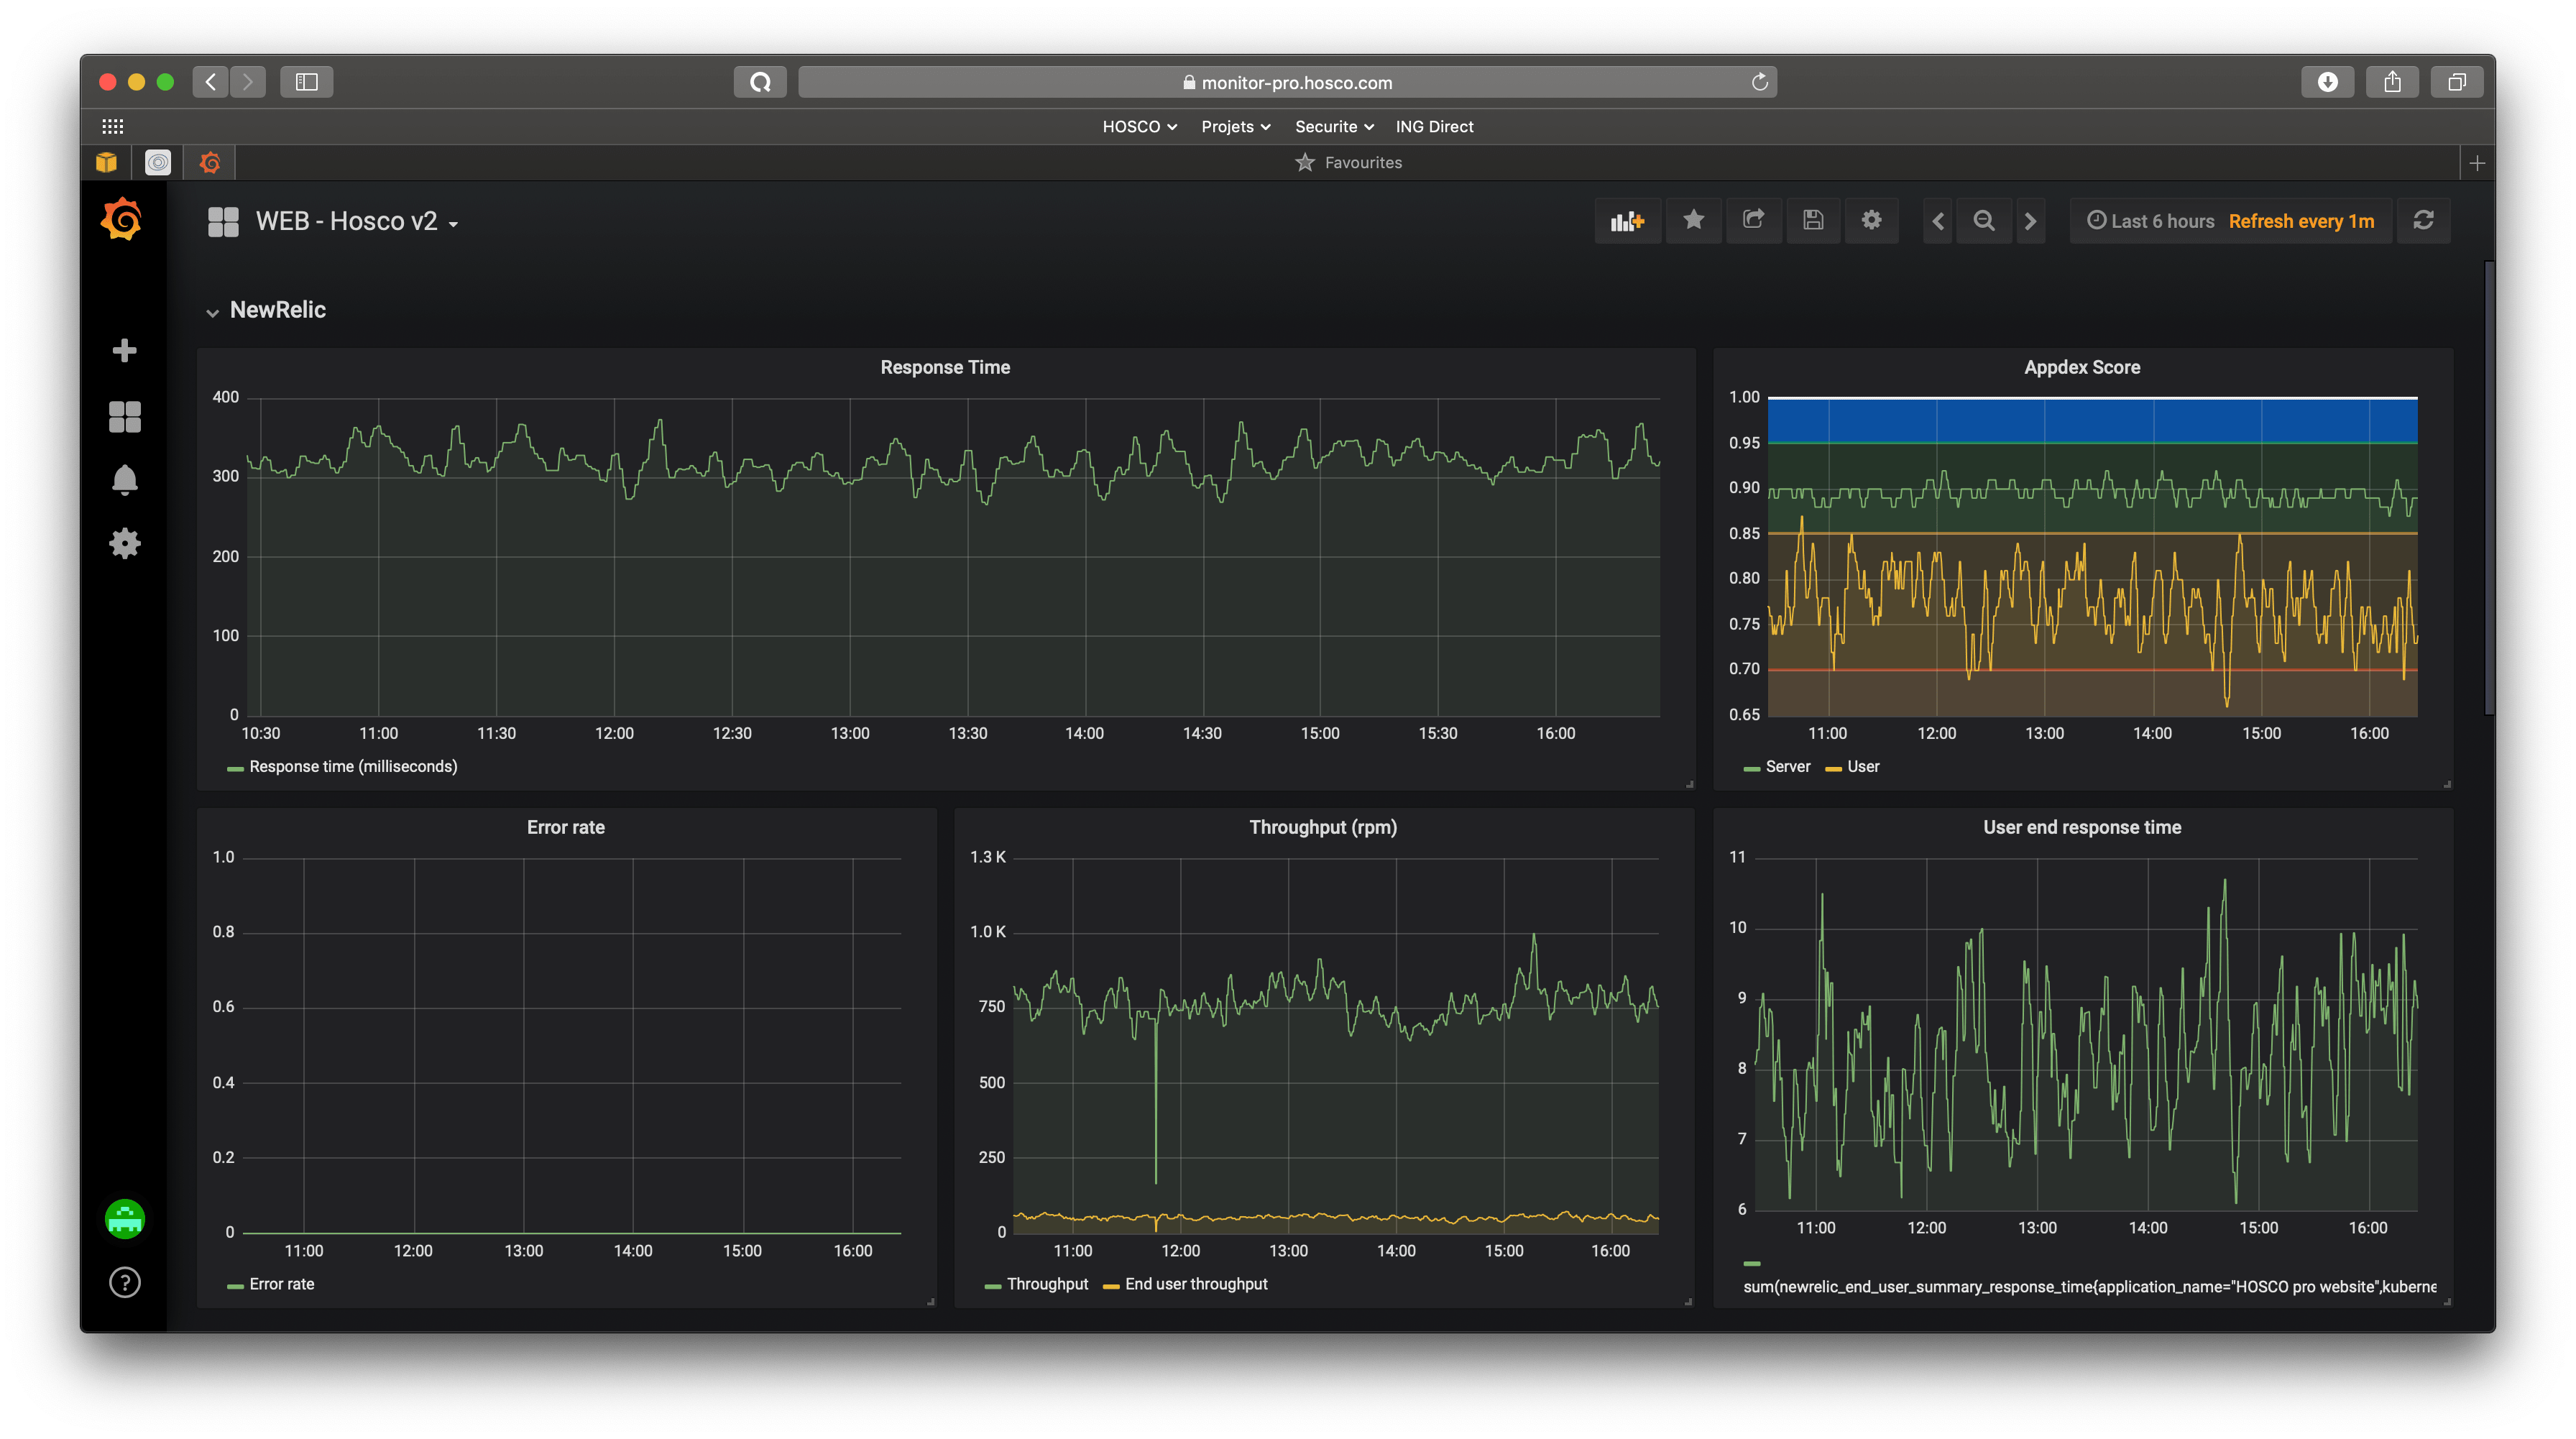
And finally, you can get your metrics in Prometheus or Grafana with a simple query in Prometheus
sum(newrelic_application_summary_response_time_milliseconds{application_name="HOSCO pro website",kubernetes_name="newrelic-exporter-pro"})